ELK Stack Setup Guide: Elasticsearch + Logstash + Kibana + Kafka Full Architecture
Complete guide to building an enterprise-grade ELK log collection and analysis system using Elasticsearch, Logstash, Kibana, and Kafka with Filebeat, including architecture comparison and step-by-step deployment
ElasticsearchELKKibanaKafkaLogstash日志分析
1620 Words
2018-09-11
Logs are essential for understanding system health – they include system logs, application logs, and security logs. Operations and development teams rely on logs to monitor servers, track application behavior, identify errors, and trace root causes. A reliable, secure, and scalable log collection and analysis solution makes troubleshooting significantly easier when things go wrong.
This guide compares three common ELK deployment patterns and walks through a full production setup:
- Filebeat -> Elasticsearch -> Kibana
- Filebeat -> Logstash -> Kafka & ZooKeeper -> Logstash -> Elasticsearch -> Kibana
- Filebeat -> Kafka & ZooKeeper -> Logstash -> Elasticsearch -> Kibana
Architecture Overview
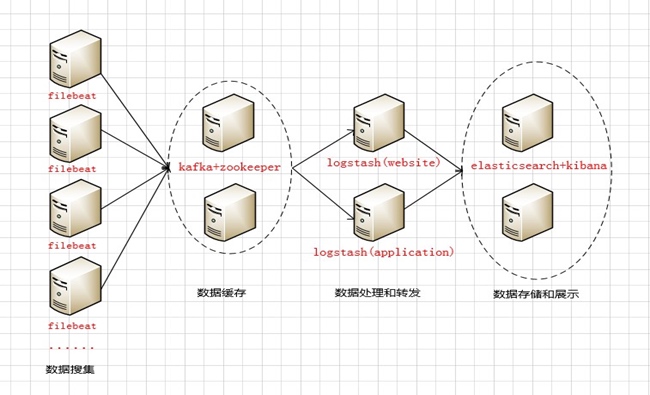
The architecture flows from left to right through four layers:
- Data Collection Layer – Filebeat agents collect logs and send them to the Kafka broker cluster queue.
- Data Buffering Layer – Kafka temporarily stores the incoming logs in its broker cluster (acting as the message producer side).
- Data Processing Layer – Logstash pulls logs from Kafka in real time, parses and transforms them, then forwards the processed data to Elasticsearch (acting as the message consumer side).
- Storage & Visualization Layer – Elasticsearch stores the logs locally, and Kibana provides the visualization dashboard. With Elasticsearch running in cluster mode, Nginx reverse-proxies the Kibana endpoint to provide a single access point for users.
Server Inventory
| Server Name | IP Address | Role | Function |
|---|---|---|---|
| kz1 | 172.31.2.2 | Kafka + ZooKeeper | Kafka broker node 1 |
| kz2 | 172.31.2.3 | Kafka + ZooKeeper | Kafka broker node 2 |
| logstash-web | 172.31.2.4 | Logstash | Process & forward web logs |
| logstash-app | 172.31.2.5 | Logstash | Process & forward app logs |
| es-node1 | 172.31.2.6 | Elasticsearch + Kibana | Data storage & visualization |
| es-node2 | 172.31.2.7 | Elasticsearch + Kibana | Data storage & visualization |
Hardware Specifications
| Server Type | Instance Type | CPU | RAM | Disk |
|---|---|---|---|---|
| Kafka broker cluster | r5.xlarge | 4 | 32GB | 1TB |
| Logstash | c5.2xlarge | 8 | 16GB | 100GB |
| Elasticsearch + Kibana | r5.xlarge | 4 | 32GB | 2TB |
Pre-Deployment Preparation
Perform these steps on all six servers.
1. Configure Hostnames
Edit /etc/hosts on each server:
172.31.2.2  kz1
172.31.2.3  kz2
172.31.2.4  logstash-web
172.31.2.5  logstash-app
172.31.2.6  es-node1
172.31.2.7  es-node2
Verify by pinging any hostname from any server. If running on AWS EC2, make sure ICMP traffic is allowed in your security group rules.
2. System Tuning
Increase file descriptor limits:
Edit /etc/security/limits.conf:
*    soft    nofile    65535
*    hard    nofile    65535
*    soft    nproc     2048
*    hard    nproc     4096
Log out and back in, then verify with ulimit -n (should show 65535).
Kernel parameter tuning:
Edit /etc/sysctl.conf:
vm.max_map_count = 262144    # Required for Elasticsearch -- too low and ES won't start
vm.swappiness = 0             # Disable swap usage
Apply changes: sudo sysctl -p
3. Software Packages
Download the following packages to /usr/local/programs/src:
- jdk-8u151-linux-x64.tar.gz
- filebeat-5.5.2-linux-x86_64.tar.gz
- kafka_2.12-2.0.0.tgz
- zookeeper-3.4.13.tar.gz
- logstash-5.5.2.tar.gz
- elasticsearch-5.5.2.tar.gz
- kibana-5.5.2-linux-x86_64.tar.gz
4. Install and Configure Supervisor
sudo mkdir -p /usr/local/programs/supervisor
sudo apt-get update
sudo apt-get install python-pip -y
sudo pip install supervisor
sudo su
/usr/local/bin/echo_supervisord_conf > /usr/local/programs/supervisor/supervisord.conf
Edit the Supervisor configuration (supervisord.conf):
[inet_http_server]
port=127.0.0.1:9001

[supervisord]
logfile=/usr/local/programs/supervisor/supervisord.log
environment=JAVA_HOME="/usr/local/programs/jdk"

[include]
files = conf.d/*.conf
Create the service config directory: sudo mkdir /usr/local/programs/supervisor/conf.d
Deployment Steps
1. JDK Installation
Perform on all six servers.
# Extract and rename
sudo tar -zxvf jdk-8u151-linux-x64.tar.gz -C /usr/local/programs
cd /usr/local/programs && sudo mv jdk1.8.0_151 jdk

# Add to /etc/profile
export JAVA_HOME=/usr/local/programs/jdk
export JRE_HOME=$JAVA_HOME/jre
export CLASSPATH=.:$JAVA_HOME/lib:$JRE_HOME/lib:$CLASSPATH
export PATH=$JAVA_HOME/bin:$JRE_HOME/bin:$PATH

# Apply and verify
source /etc/profile
echo $JAVA_HOME
2. ZooKeeper Cluster Setup
Perform on kz1 (172.31.2.2) and kz2 (172.31.2.3).
Extract and configure:
sudo tar -zxvf zookeeper-3.4.13.tar.gz -C /usr/local/programs
cd /usr/local/programs && sudo mv zookeeper-3.4.13 zookeeper
cd /usr/local/programs/zookeeper/conf
cp -a zoo_sample.cfg zoo.cfg
zoo.cfg configuration:
tickTime=2000
initLimit=10
syncLimit=5
dataDir=/usr/local/programs/zookeeper/data
dataLogDir=/usr/local/programs/zookeeper/logs
clientPort=2181
server.1=172.31.2.2:2888:3888
server.2=172.31.2.3:2888:3888
Key parameters:
tickTime– Heartbeat interval in milliseconds between ZooKeeper serversinitLimit– Maximum number of ticks for initial leader-follower sync (10 x 2000ms = 20s)syncLimit– Maximum number of ticks for leader-follower communication (5 x 2000ms = 10s)- Port 2888 – Leader-follower data exchange
- Port 3888 – Leader election
Create myid files:
# On kz1 (172.31.2.2)
echo 1 > /usr/local/programs/zookeeper/data/myid

# On kz2 (172.31.2.3)
echo 2 > /usr/local/programs/zookeeper/data/myid
The myid file must be inside the dataDir directory. ZooKeeper reads it at startup to determine which server it is.
Start and verify:
# Start (runs in background by default)
sudo /usr/local/programs/zookeeper/bin/zkServer.sh start

# Check cluster status
/usr/local/programs/zookeeper/bin/zkServer.sh status
# One node should show "Mode: leader", the other "Mode: follower"
3. Kafka Cluster Setup
Extract and configure JVM heap:
sudo tar -zxvf kafka_2.12-2.0.0.tgz -C /usr/local/programs/kafka
Edit bin/kafka-server-start.sh – set heap to half of available RAM:
if [ "x$KAFKA_HEAP_OPTS" = "x" ]; then
    export KAFKA_HEAP_OPTS="-Xmx4G -Xms4G"
fi
server.properties configuration:
broker.id=1                           # Unique ID per broker
port=9092
host.name=kz1                        # Must match hostname

num.network.threads=4                 # Match CPU core count
num.io.threads=8                      # 2x CPU core count
socket.send.buffer.bytes=102400
socket.receive.buffer.bytes=102400
socket.request.max.bytes=104857600

log.dirs=/usr/local/programs/kafka/logs
num.partitions=1
num.recovery.threads.per.data.dir=1

log.retention.hours=168               # 7-day retention
log.segment.bytes=1073741824          # 1GB per segment
log.retention.check.interval.ms=300000

zookeeper.connect=172.31.2.2:2181,172.31.2.3:2181
zookeeper.connection.timeout.ms=6000

group.initial.rebalance.delay.ms=0
Copy the config to kz2 and change broker.id=2 and host.name=kz2.
Start Kafka:
# Foreground
sudo /usr/local/programs/kafka/bin/kafka-server-start.sh /usr/local/programs/kafka/config/server.properties

# Background (daemon mode)
sudo /usr/local/programs/kafka/bin/kafka-server-start.sh --daemon /usr/local/programs/kafka/config/server.properties
Optional: KafkaOffsetMonitor
KafkaOffsetMonitor provides a web UI for monitoring consumer lag, partition offsets, and consumption progress. Download from GitHub and run:
java -cp KafkaOffsetMonitor-assembly-0.2.0.jar \
  com.quantifind.kafka.offsetapp.OffsetGetterWeb \
  --zk kz1:2181 \
  --port 8089 \
  --refresh 10.seconds \
  --retain 1.days
4. Logstash Setup
Extract and configure JVM:
sudo tar -zxvf logstash-5.5.2.tar.gz -C /usr/local/programs/logstash
Edit config/jvm.options – set heap to half of available RAM:
-Xms8g
-Xmx8g
logstash.yml configuration:
path.data: /usr/local/programs/logstash/data
pipeline.workers: 8                  # Match CPU core count
pipeline.output.workers: 4
pipeline.batch.size: 1000            # Tune based on throughput
pipeline.batch.delay: 5
path.config: /usr/local/programs/logstash/config/conf.d
path.logs: /usr/local/programs/logstash/logs
Start Logstash:
# Foreground
sudo /usr/local/programs/logstash/bin/logstash -f /usr/local/programs/logstash/conf/oc-logstash-kafka.conf

# Background
sudo nohup /usr/local/programs/logstash/bin/logstash -f /usr/local/programs/logstash/conf/oc-logstash-kafka.conf &
Install GeoIP plugin:
cd /usr/local/programs/logstash
sudo ./bin/logstash-plugin install logstash-filter-geoip
sudo ./bin/logstash-plugin list | grep geoip    # Verify
Install X-Pack plugin:
sudo ./bin/logstash-plugin install x-pack
Add to logstash.yml:
xpack.monitoring.elasticsearch.username: logstash_system
xpack.monitoring.elasticsearch.password: logstashpassword
5. Elasticsearch Cluster Setup
Extract and configure JVM:
sudo tar -zxvf elasticsearch-5.5.2.tar.gz -C /usr/local/programs/elasticsearch
Edit config/jvm.options – set heap to half of available RAM:
-Xms4g
-Xmx4g
Optionally switch from CMS to G1 garbage collector (use with caution – incorrect settings can prevent ES from starting):
-XX:+UseG1GC
-XX:MaxGCPauseMillis=200
elasticsearch.yml configuration:
cluster.name: elasticsearch-application
node.name: node-1
node.master: true
node.data: true
node.attr.rack: r1
path.data: /usr/local/programs/elasticsearch/data
path.logs: /usr/local/programs/elasticsearch/logs
bootstrap.memory_lock: true          # Lock memory to prevent swapping
network.host: 192.168.2.6
http.port: 9200
discovery.zen.ping.unicast.hosts: ["172.31.2.6:9300", "172.31.2.7:9300"]
discovery.zen.minimum_master_nodes: 3    # (total nodes / 2) + 1 to prevent split brain
gateway.recover_after_nodes: 3

# X-Pack and elasticsearch-head plugin settings
http.cors.enabled: true
http.cors.allow-origin: "*"
xpack.security.enabled: true
xpack.security.transport.ssl.enabled: true
http.cors.allow-headers: Authorization,X-Requested-With,Content-Length,Content-Type
Copy the config to es-node2 (172.31.2.7) and change node.name: node-2 and network.host: 192.168.2.7.
Start Elasticsearch:
sudo /usr/local/programs/elasticsearch/bin/elasticsearch
Install elasticsearch-head plugin (web-based cluster management UI):
cd /usr/local/programs
sudo git clone https://github.com/mobz/elasticsearch-head.git
cd elasticsearch-head
sudo apt-get install nodejs npm
sudo ln -s /usr/bin/nodejs /usr/bin/node
npm install
npm run start    # Accessible on port 9100
Install and activate X-Pack:
sudo bin/elasticsearch-plugin install x-pack
# Default credentials: elastic / changeme
For X-Pack license activation details (including platinum license setup), refer to the Elastic documentation.
6. Kibana Setup
Extract and configure:
sudo tar -zxvf kibana-5.5.2-linux-x86_64.tar.gz -C /usr/local/programs/kibana
kibana.yml configuration:
server.port: 5601
server.host: "0.0.0.0"
server.name: "elk-es1"
elasticsearch.url: http://172.31.2.6:9200
kibana.index: ".kibana"
elasticsearch.username: "kibana"
elasticsearch.password: "changeme"
Install X-Pack plugin:
cd /usr/local/programs/kibana
bin/kibana-plugin install x-pack
Note: Install Kibana on the secondary ES node only – no need to install it on the master node.
7. Reset Default Passwords
After X-Pack is installed, reset the built-in user passwords via the Kibana Management UI or the REST API:
PUT _xpack/security/user/elastic/_password
{ "password": "elasticpassword" }

PUT _xpack/security/user/kibana/_password
{ "password": "kibanapassword" }

PUT _xpack/security/user/logstash_system/_password
{ "password": "logstashpassword" }
Remember to update the corresponding passwords in kibana.yml and logstash.yml after changing them.
Service Directory Reference
| Service | Install Directory | Config File |
|---|---|---|
| Kafka | /usr/local/programs/kafka | config/server.properties |
| Kafka JVM | bin/kafka-server-start.sh | |
| ZooKeeper | /usr/local/programs/zookeeper | conf/zoo.cfg |
| Logstash | /usr/local/programs/logstash | config/logstash.yml, config/conf.d/*.yml |
| Logstash JVM | config/jvm.options | |
| Elasticsearch | /usr/local/programs/elasticsearch | config/elasticsearch.yml |
| ES JVM | config/jvm.options | |
| Kibana | /usr/local/programs/kibana | config/kibana.yml |
All services are managed via Supervisor for process monitoring and automatic restarts.
Port Reference
| Port | Service |
|---|---|
| 9092 | Kafka broker |
| 2181 | ZooKeeper client connections |
| 2888 | ZooKeeper leader-follower communication |
| 3888 | ZooKeeper leader election |
| 5044 | Logstash input |
| 5601 | Kibana web UI |
| 9200 | Elasticsearch HTTP API |
| 9300 | Elasticsearch inter-node communication |
Common Maintenance Commands
Kafka Operations
# Create a topic
bin/kafka-topics.sh --zookeeper 172.31.2.2:2181,172.31.2.3:2181 \
  --create --topic my-topic --replication-factor 2 --partitions 8

# List all topics
bin/kafka-topics.sh --zookeeper 172.31.2.2:2181,172.31.2.3:2181 --list

# Describe a topic
bin/kafka-topics.sh --zookeeper 172.31.2.2:2181,172.31.2.3:2181 \
  --describe --topic my-topic

# Increase partitions
bin/kafka-topics.sh --zookeeper 172.31.2.2:2181,172.31.2.3:2181 \
  --alter --topic my-topic --partitions 16

# Delete a topic
bin/kafka-topics.sh --zookeeper 172.31.2.2:2181,172.31.2.3:2181 \
  --delete --topic my-topic

# Check consumer lag
bin/kafka-run-class.sh kafka.tools.ConsumerOffsetChecker --group pv

# Find under-replicated partitions
bin/kafka-topics.sh --zookeeper 172.31.2.2:2181,172.31.2.3:2181 \
  --describe --under-replicated-partitions
ZooKeeper Operations
Use the four-letter commands via nc to inspect ZooKeeper status:
echo stat | nc localhost 2181    # Check leader/follower status
echo ruok | nc localhost 2181    # Health check (responds "imok")
echo dump | nc localhost 2181    # List pending sessions and ephemeral nodes
echo conf | nc localhost 2181    # Show server configuration
echo cons | nc localhost 2181    # List connected clients
Connect to the ZooKeeper CLI:
zkCli.sh -server localhost:2181
# ls /              -- list znodes
# create /zk "data" -- create a znode
# get /zk           -- read a znode
# set /zk "newdata" -- update a znode
# delete /zk        -- delete a znode
Elasticsearch Operations
# List all indices
curl -XGET "http://elastic:[email protected]:9200/_cat/indices?v"

# Open/close an index
curl -XPOST 'http://elastic:[email protected]:9200/index-name/_open'
curl -XPOST 'http://elastic:[email protected]:9200/index-name/_close'

# Check if an index exists
curl --head http://elastic:[email protected]:9200/index-name

# Delete an index (supports wildcards)
curl -XDELETE 'http://elastic:[email protected]:9200/index-name'

# Clear index cache
curl -XPOST 'http://elastic:[email protected]:9200/index-name/_cache/clear'

# Refresh index
curl -XPOST 'http://elastic:[email protected]:9200/index-name/_refresh'

# Simple search
curl -XGET 'http://localhost:9200/_search?q=hello+world'

# View cluster nodes
curl -XGET -u elastic "http://172.31.2.6:9200/_cat/nodes?pretty"
Access URLs
| Service | URL |
|---|---|
| Kibana | http://your-server:5601 |
| Elasticsearch | http://your-server:9200 |
| Elasticsearch Head | http://your-server:9100/?auth_user=elastic&auth_password=changeme |
Related Articles
- Elasticsearch Tutorial: Core Concepts of Indices, Documents, and Query APIs - Deep dive into ES fundamentals and query syntax
- AWS EKK Log System Setup: Elasticsearch + Kinesis + Kibana Hands-On Guide - AWS managed services approach to centralized logging
Comments
Join the discussion — requires a GitHub account